
To succeed in the online retail business, it is important to understand that things that seem tiny on the face value may have massive repercussions. In fact, it is the tiny things that end up becoming the most relatable to us as consumers, but we rarely recognize the enormity that they encompass. Did you know that the now ubiquitous Apple logo shares a deep relationship with the Fibonacci sequence? Or that the iconic Windows startup sound was created by the legendary ambient producer Brian Eno, after he was given a list of 92 adjectives describing a sound whose maximum length could only be 3.25 seconds?
These stories show us that the devil is in the details, and the same is true for the online seller. One of the major advantages of owning and operating your own website is that you also get to own the data that the website collects. This data is a precious entity, because analyzing it can provide critical information about various aspects of your business, like customer retention stats, market behaviour and even website design bottlenecks. By looking at data collected from your website in multiple ways, you can gain different perspectives of looking at and recognizing a problem and finding creative solutions to it. Of course, we recommend that you also utilize a multi channel inventory management system like Browntape, which not only provides you with additional data from your supply chain and warehouse processes, but also gives you tools for data visualization and analysis. In this article, we are going to mark out 5 key performance indicators you can extract from your website, and which you should always keep an eye on.
KPIs for the Online Retail Website
1. Website Traffic

Web traffic is the basic metric the online seller must keep an eye on. In the real world, this is equivalent to the term ‘footfall’, which is commonly applied to brick-and-mortar stores. It is important to study the web traffic in terms of daily, weekly and monthly site visits, and look for dips or spikes in the data. This metric gives you a clear and succinct picture of the state of your online webstore. While your aim should be to drive as much traffic as you can to your online store, this metric also comes in handy in scaling up or down your server needs. It is also important to have an idea of the average amount of time the user is spending on the website, and the points of interaction that the user has with the website.
2. Webpage Visits

A typical website is made up of many individual webpages. A typical online retail website has hundreds and thousands of webpages, if we go by the general rule that every individual product gets its own webpage. If that is the case, it is not enough to know how many users are landing up on your website and for how long. It is as important to know where on the website are they spending that time. Looking at a dataset of webpage visits not only gives you an idea of customer preferences, but also helps you understand how you can structure your website for more customer retention. By adding the right hyperlinks on the right webpages, you can divert the incoming traffic to various other parts of your website. This metric also tells you how your customers interact with individual webpages, and give you an insight into why certain webpages are more popular than others.
3. Add-to-Cart Rate
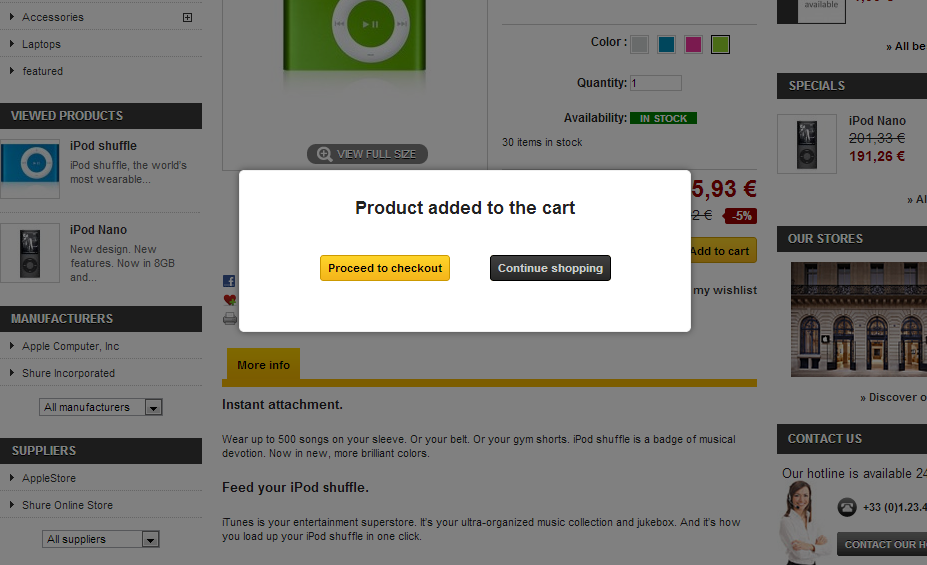
Add-to-cart rate is perhaps one of the most important KPIs you can glean through your online retail store. Users on an online retail webstore can broadly fall under two categories – those who buy something at the end of their visit and those who don’t. The three metrics that we are going to discuss now are the key ones that differentiate the former from the latter. Adding a product to your shopping cart shows intent, but the fact remains that 60 to 70 percent of online shoppers do not complete the transaction after having added products to their cart. This is a wide margin, and one that is potentially lucrative, because knowing how many customers added products their cart means an opportunity to push them into completing the sale.
4. Cart Abandonment Rate

Cart abandonment rate is the amount of shopping carts that have been filled and abandoned in a given time frame. As discussed above, this number generally amounts to around 60 to 70 percent of the shoppers. Getting to know the cart abandonment rate helps you take a closer look at the checkout process. Is there a bottleneck in your website checkout design that is impending the flow of successful transactions? This can be anything from a tedious information form to file before the checkout or even insufficient support from your payment verifier. It is important to produce a trustworthy image especially at this stage of the transaction, because the cardinal rule is that if a website looks dubious, it most probably is.
5. User-to-Customer Conversion Rate

Finally, this number tells you how many of the total site visits have been converted into successful sales. This along with the user return rate, tells you about bottlenecks that might exist within the website. Users generally land up on an online retail website through multiple ways, from Google searches, advertisements, email newsletters or even clickbait. Knowing where the user is coming from is an important piece of information because it tells you a lot about the health social media strategies and the inlets to your website.
The important thing to understand about these and other key performance indicators is that it is generally not what they represent, but what they don’t, where their importance lies. For example, what the add to cart rates don’t tell you is the amount of users that visited your website but didn’t add anything to their carts. You would have to deduce them by subtracting the number from the total site traffic of your website.
Then, you could look at the webpages that these visitors visited and try to find out why they didn’t add the product to cart, and why they didn’t proceed to checkout. In this way, you can use various KPIs in tandem with each other to create an image of the user’s experience in real time, and work to improve it.
To know more, get in touch with Browntape. We are India’s leading ecommerce solutions experts, and we are always happy to help!