Skip to content
Software
OMS Software
All Features
Inventory Management
Order Management
Courier Management
Remittance Management
Analytics Dashboard and Reports
ERP Integrated OMS
Payment Reconciliation
Ginesys One with OMS
Services
eCommerce Account Management
Digital Marketing Services
Web Development
Shopify
Woo Commerce
WordPress
Integrations
All Integrations
Marketplace Integrations
Amazon
Flipkart
Myntra
Shopping Carts
Magneto
Shopify
Woo Commerce
Bigcommerce
ERP Integrations
Clients
Pricing
Resources
Blog
Videos
Seller Fees Calculator
BT Seller
Menu
Software
OMS Software
All Features
Inventory Management
Order Management
Courier Management
Remittance Management
Analytics Dashboard and Reports
ERP Integrated OMS
Payment Reconciliation
Ginesys One with OMS
Services
eCommerce Account Management
Digital Marketing Services
Web Development
Shopify
Woo Commerce
WordPress
Integrations
All Integrations
Marketplace Integrations
Amazon
Flipkart
Myntra
Shopping Carts
Magneto
Shopify
Woo Commerce
Bigcommerce
ERP Integrations
Clients
Pricing
Resources
Blog
Videos
Seller Fees Calculator
BT Seller
Log in
Take A Demo
Software
OMS Software
All Features
Inventory Management
Order Management
Courier Management
Remittance Management
Analytics Dashboard and Reports
ERP Integrated OMS
Payment Reconciliation
Ginesys One with OMS
Services
eCommerce Account Management
Digital Marketing Services
Web Development
Shopify
Woo Commerce
WordPress
Integrations
All Integrations
Marketplace Integrations
Amazon
Flipkart
Myntra
Shopping Carts
Magneto
Shopify
Woo Commerce
Bigcommerce
ERP Integrations
Clients
Pricing
Resources
Blog
Videos
Seller Fees Calculator
BT Seller
Log in
Take a Demo
Menu
Software
OMS Software
All Features
Inventory Management
Order Management
Courier Management
Remittance Management
Analytics Dashboard and Reports
ERP Integrated OMS
Payment Reconciliation
Ginesys One with OMS
Services
eCommerce Account Management
Digital Marketing Services
Web Development
Shopify
Woo Commerce
WordPress
Integrations
All Integrations
Marketplace Integrations
Amazon
Flipkart
Myntra
Shopping Carts
Magneto
Shopify
Woo Commerce
Bigcommerce
ERP Integrations
Clients
Pricing
Resources
Blog
Videos
Seller Fees Calculator
BT Seller
Log in
Take a Demo
Dashboards & Reports
Get visual insights about your e-commerce business on our signature ‘insights dashboard’
Single Shot Operations Summary
Illustrated Sales Analysis
Cumulative Figures Panel
Reports
Performance of Products
Visual Display
Top Customers
Take A Demo
Everything you Need for eCommerce Analytics
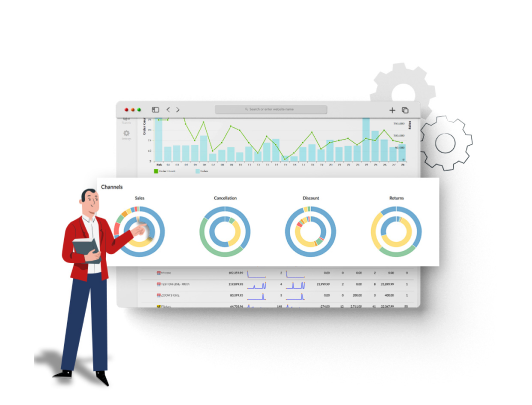
Graphical Representation that Simplify Metrics
Visually easy to understand, graphical display of sales, order count, cancellations, discounts and returns.
Track channel-wise data and make the right business decisions.
Illustrated Sales Analysis
View a ready visual analysis of your best selling items, top-selling cities, best selling days and even your best selling time of the day.
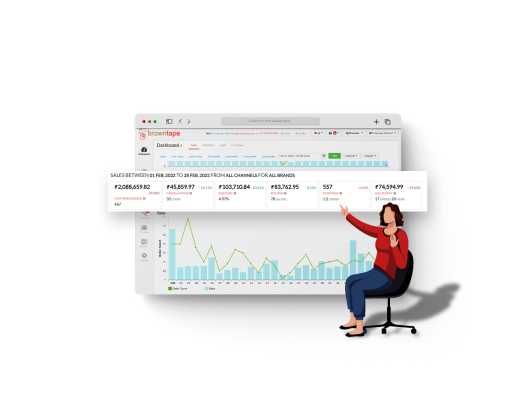
Cumulative Figures Panel
View cumulative sales figures for a defined date range- Confirmed orders, cancellations, discounts, returns, items sold and average sales per day.
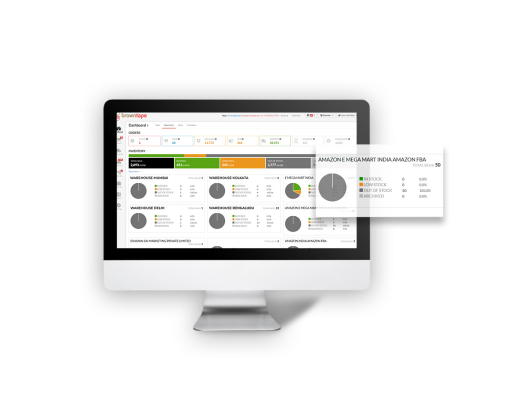
Single Shot Operations Summary
View a summary of inventory, warehouse stocks, orders & listings in a colourful display format
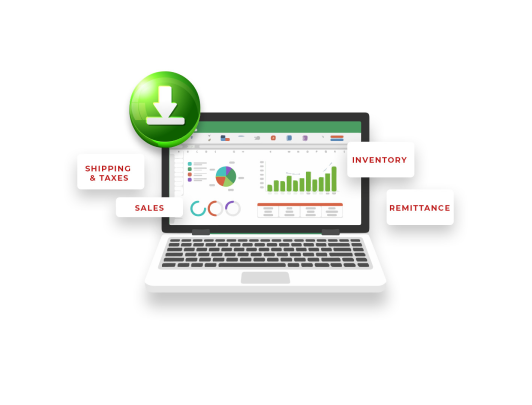
Reports
Download reports in excel format for inventory, remittance, sales, returns, shipping and taxes. Create your report for a customized date range.
Trusted by Leading Indian Enterprises
Order
Management
Courier
Management
Payment
Management
Warehouse
Management
Inventory
Management
Ecommerce
Integrations
Omnichannel
Store
Analytics Dashboard
Report
Why Use Browntape?
Safety Buffer
Stock
Scan
and pack
Safety Buffer
Stock
Mother - Child Accounts
Powerful API Extendability
Reduce Order
Return Rates
Avoid Repetitive
Tasks
2028-bit Encrypted Security
Inventory
Ledger
Achieve Higher Seller Ratings
Endlessly
Scalable
Remarkable
Support
Automatic Order Processing
Say Goodbye to Complicated Excel Sheets with Browntape - The Best eCommerce Solution
Eliminate Costly Human Errors
Achieve High Seller Ratings & Customer Satisfaction
Get Customized Integrations in the Shortest Turn-a- Around Time
Grow Your Ecommerce Business, Prosper with Browntape
Expand Your Business with our Smart, Simple and Intuitive Panel
Enjoy Dedicated Support. You’ll Always Talk to a Human.
Reduce Order Return Rate
Avoid Repetitive Tasks with Automation
Leave API Challenges to Us. We Win at it.
Chat With Us
Name
Email
Company Name
Mobile Number
Send